
I'm really glad to open this 2016 Advent Blog. For sure, like me, you were probably confrontated to the question of the performance of your Magento project. In fact, it's definitely a common topic for all of us.
How many times, I had to explain to my customers why their shop is slow after they have been installed by their previous agency or newbie developer a 70 USD Template slowing down the whole shop. It's cheaper and even better to use the standard RWD template of Magento instead to use those multi-purpose templates. You will hear from your customer: "I don't like this template!", "ok, why not!" you will answer. But hey, the core is good enough to make something which fits to the taste of your customer and the effort is definitely the same as buying a template, fixing all the issues and customizing it for your customer.
Of course, let's be fair, it's not only those kind of templates, to not say crappy templates, which may have an impact on the performance. Lots of criteria are involved and the chance is big that you already knows them. However let's list them:
- a misconfigured Web or Database Server,
- PHP 5.x,
- no OpCode
- slow code,
- slow hard disk,
- use of a shared hosting,
- low memory,
- big trafic but no adapted server resources,
- too many PHP/Apache or Magento modules installed,
- cron using HTTP instead of the command line interface,
- communication with external services (e.g. creditor service) slowing down your application
- or deactivated cache (don't be surprised, I saw it a lot!)
You may use some artefacts to hide these bottlenecks and most of us do it because we are under pressure to find a solution. For example, you will be tempted to install a full page cache thanks to a module bought for a couple of bucks or you will fight with Varnish. Then you will be pride to show to your customer that the homepage loads in few milliseconds, but you completely put on side that the checkout process still need few seconds to load the cart and is so important as the homepage, to generate revenue.
There are some tools in the neighborhood which may help you to fix around 80% of your bottleneck just in a half day, reducing time and cost. You may have a gain of speed of around 70% just by fixing those bottleneck and by using PHP 7. So a website having a loading page of 1.5sec on the homepage (huge isn't it? There is even worse), may have a loading time of around 200 until 350ms. Great improvements !
Today I would prefer to start with fixing the bottleneck or even better, prevent to have them, instead to struggle with a full page cache which needs more time to be correctly configured as it depends on your template.
The full page cache comes on a second phase, when the shop has really lots of traffic and is enough rentable to go further with system complexity. Still, you'll need to optimize your code :-)
Profiling Tools
Let's go now more in details. I'll present you here some of profiling tools, commercial or free and explain you what are their advantages and drawbacks.
When I talk about profiling your code, I mean analysing the different steps used by your application to execute a task and determine the time they need to be done. Some tools provide the number of times a call is done for a method or a function. Those tools helps to facilitate the analyze. You may also create your own functions with microtime(true)
Don't be afraid if those numbers are high. For example, in Magento 2, the funtion __() is used very often to translate strings. It doesn't mean that it slows down the application.
Unlike, be careful to not have an unexpected high number of call for a method when it should not be the case. In Magento 1, the color swatches feature on product list and product view page could be a real bottleneck if you have lots color options in your database. By analyzing the code, I discovered, for example, that the list is not cached. At launch of the shop, everything is fine but after a period of time, when more and more products come, I discovered that the load of the product view page was really crazy slow. Caching the result of the color swatches, reduced dramatically the bottleneck. A profiler tool helped me to discover it.
I listed below some tools I used and tested for some of my projects:
- Xdebug profiler (free)
- XHProf from Facebook (free)
- Blackfire.io (commercial)
- NewRelic (commercial)
- Tideways (commercial)
Let's be direct, my preference goes to blackfire.io, because it's french :-), although NewRelic or Tideways provides also interesting information. I'll go more in details why further.
Be aware that any solutions, here, takes more or less some resources on PHP process side. So if you are really sensible about performance, just don't use them on production.
Xdebug Profiler
Xdebug is a PHP module that you install separately thanks to such a command on your machine pecl install xdebug (linux) or brew install php<VERSION>-xdebug (OSX). I would not recommand to install on a production server as it consums itself lots of resources when it's needed. You may enable it, however, only when necessary on a short period of time. In fact, in this case, I would recommand to use a monitoring tool like NewRelic or Tideways. The memory and cpu footprint is much more smaller than xdebug.
How it works?
To enable the profiler in the xdebug.ini configuration, you must set the followings:
xdebug.profiler_enable = 1 # Profiling will always active, be aware that it takes lots disk space
xdebug.profiler_output_dir = /path/to/cachegrind/output
xdebug.profiler_enable_trigger = 0 # if set to 1, you can use a cookie XDEBUG_PROFILE or a GET/POST parameter XDEBUG_PROFILE to enable the profiling when you want. In this case, xdebug.profiler_enable MUST be 0
To analyze the content of the generated cachegrind profile files, you'll need to get an additional tool like the following:
- Webgrind for OSX
- Kcachegrind for Linux
- Wincachegrind for Windows
- or your favorite IDE like PHPStorm. Graph is unfortunately not available.
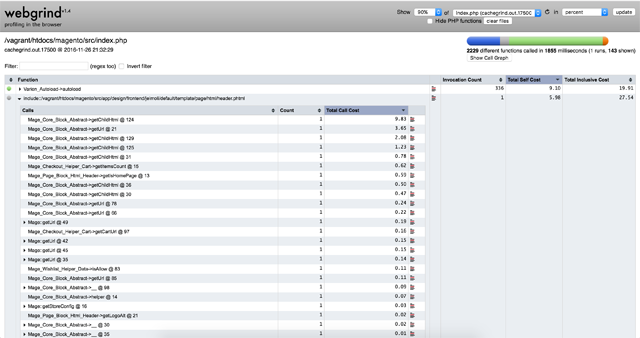
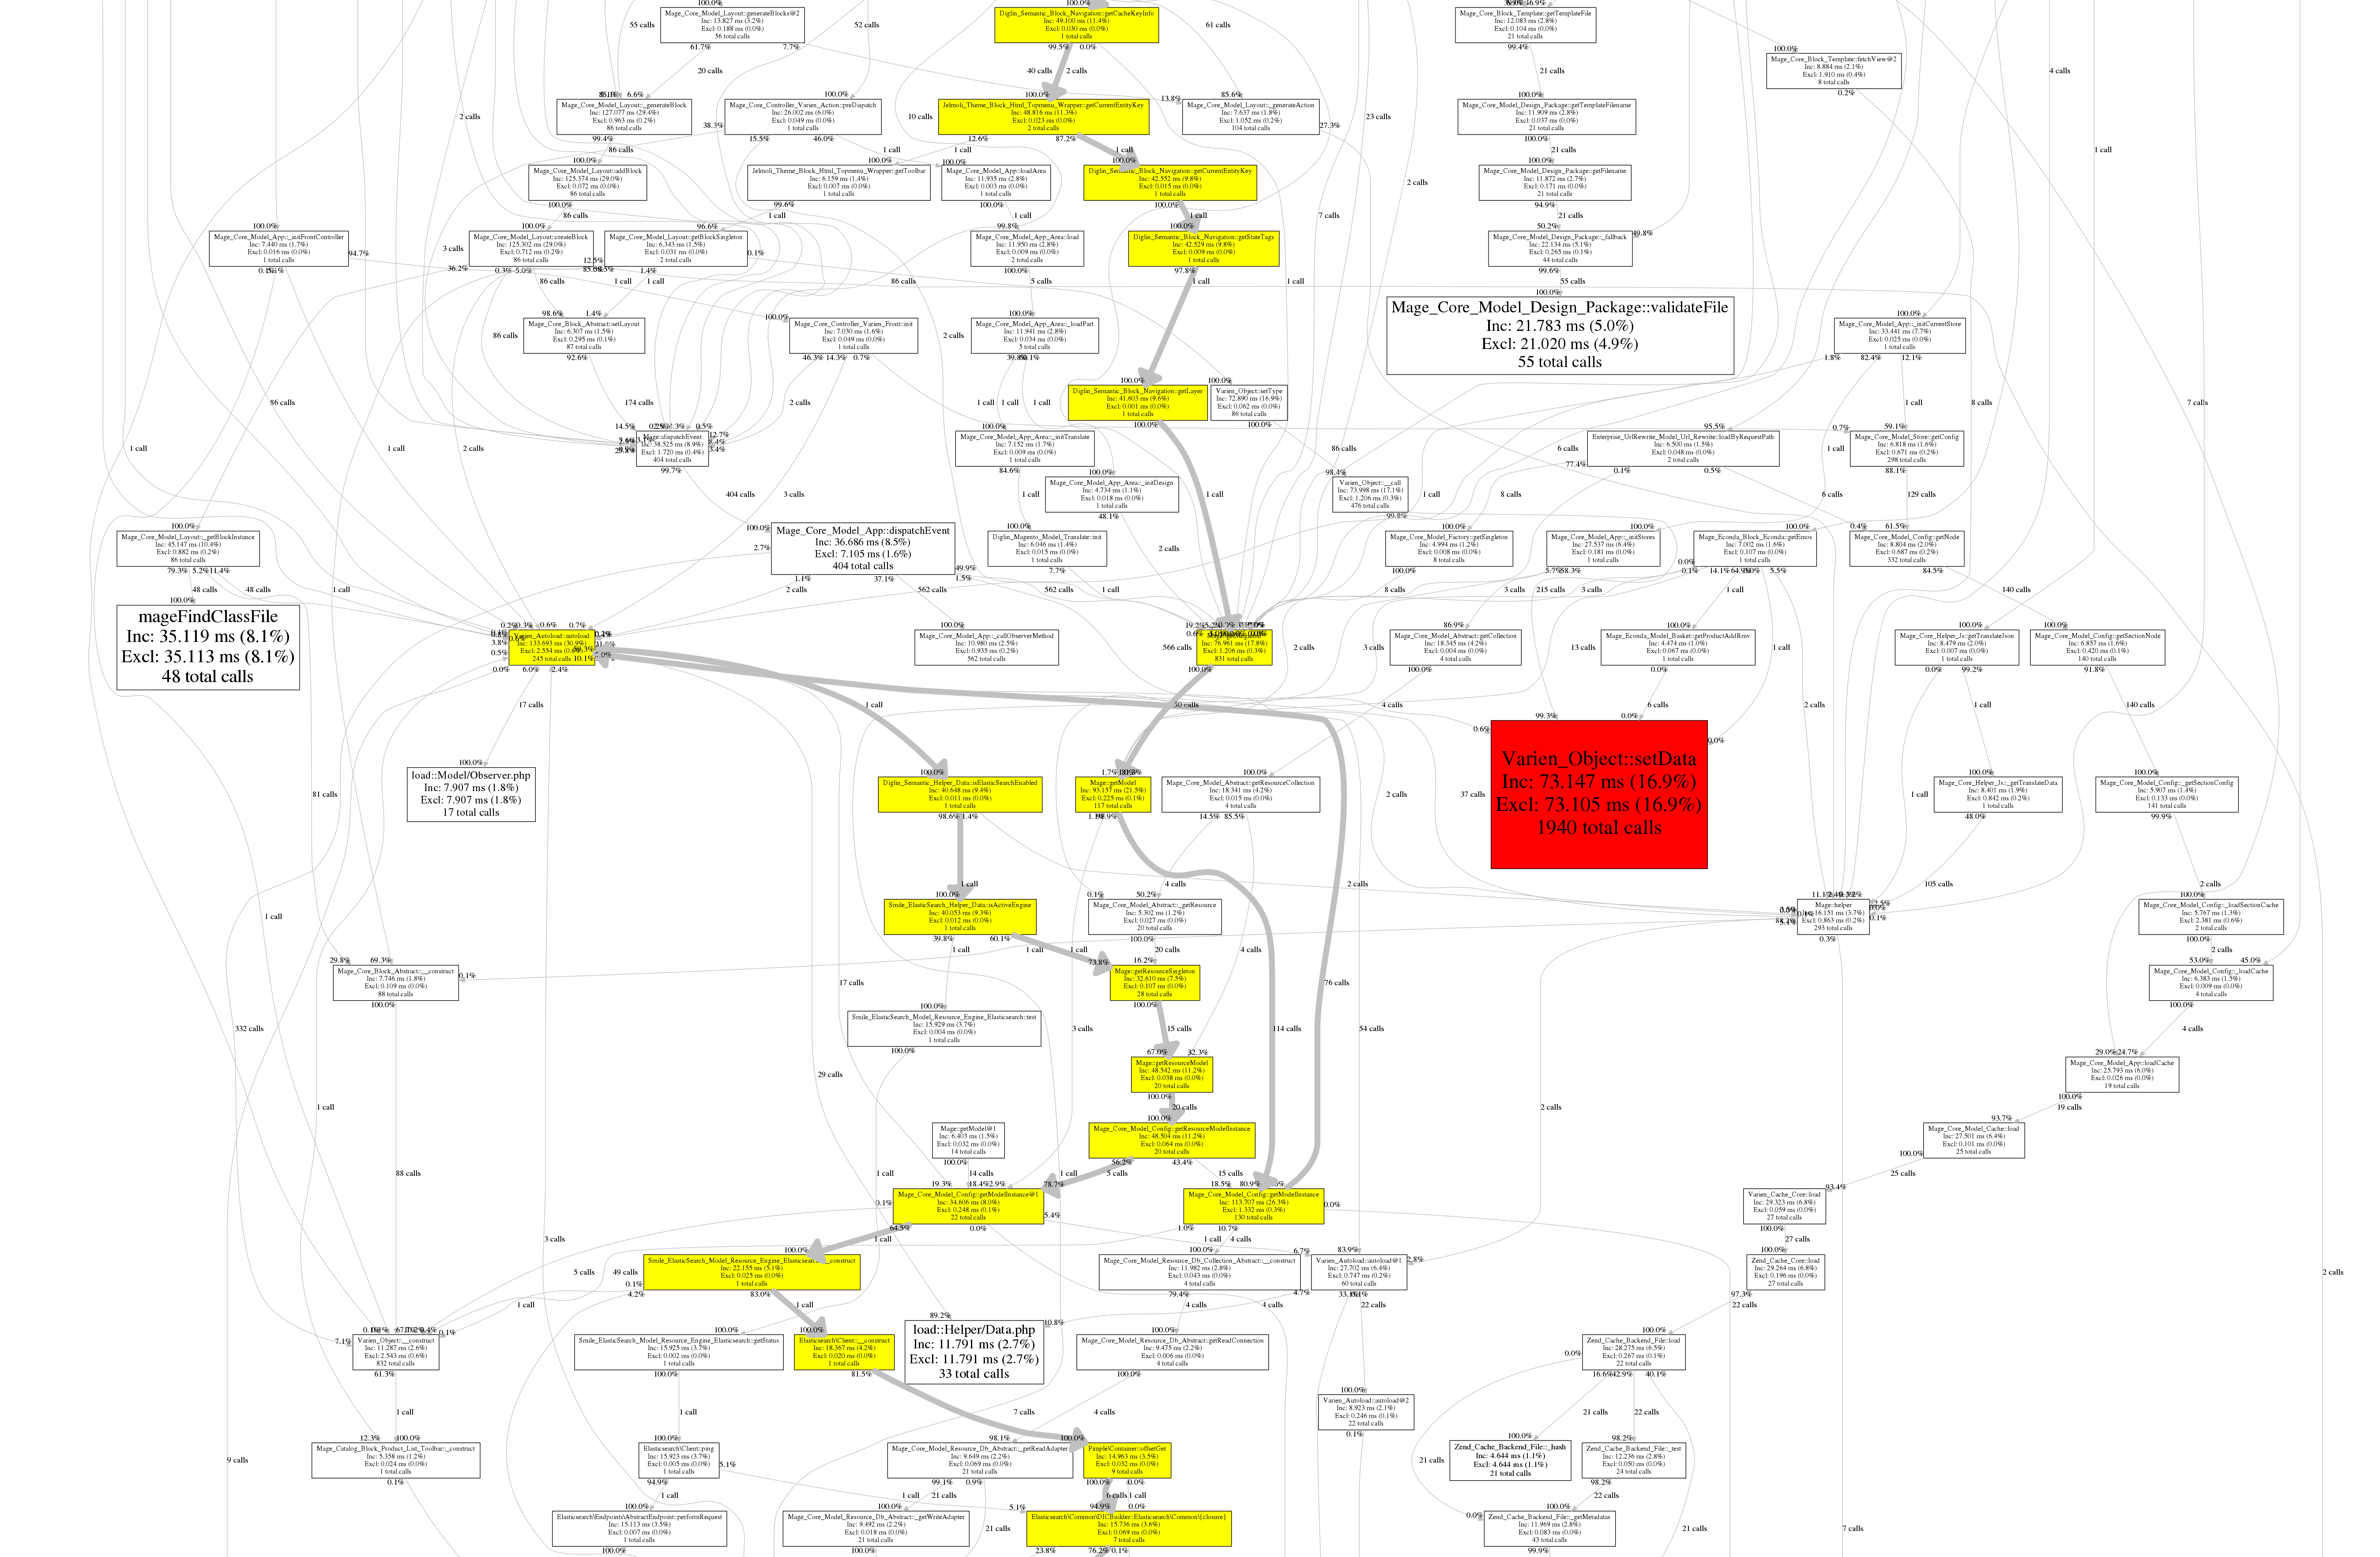
All those tools provide a detailed list of calls and times of your application methods or functions. You may also have a call graph helping you to see easily the different steps of the calls and where may be the bottleneck.
Main avantage of Xdebug Profiler is that you probably have it already installed on your machine as you may debug your code with it. As supported per default in PHPStorm, you don't need that much to install extra tools if you already use this IDE, however the graph is not available compare to other tools. XDebug is may be less convenient as commercial solutions and profiling SQL request needs other solutions.
Further information about Xdebug Profiler can be found here.
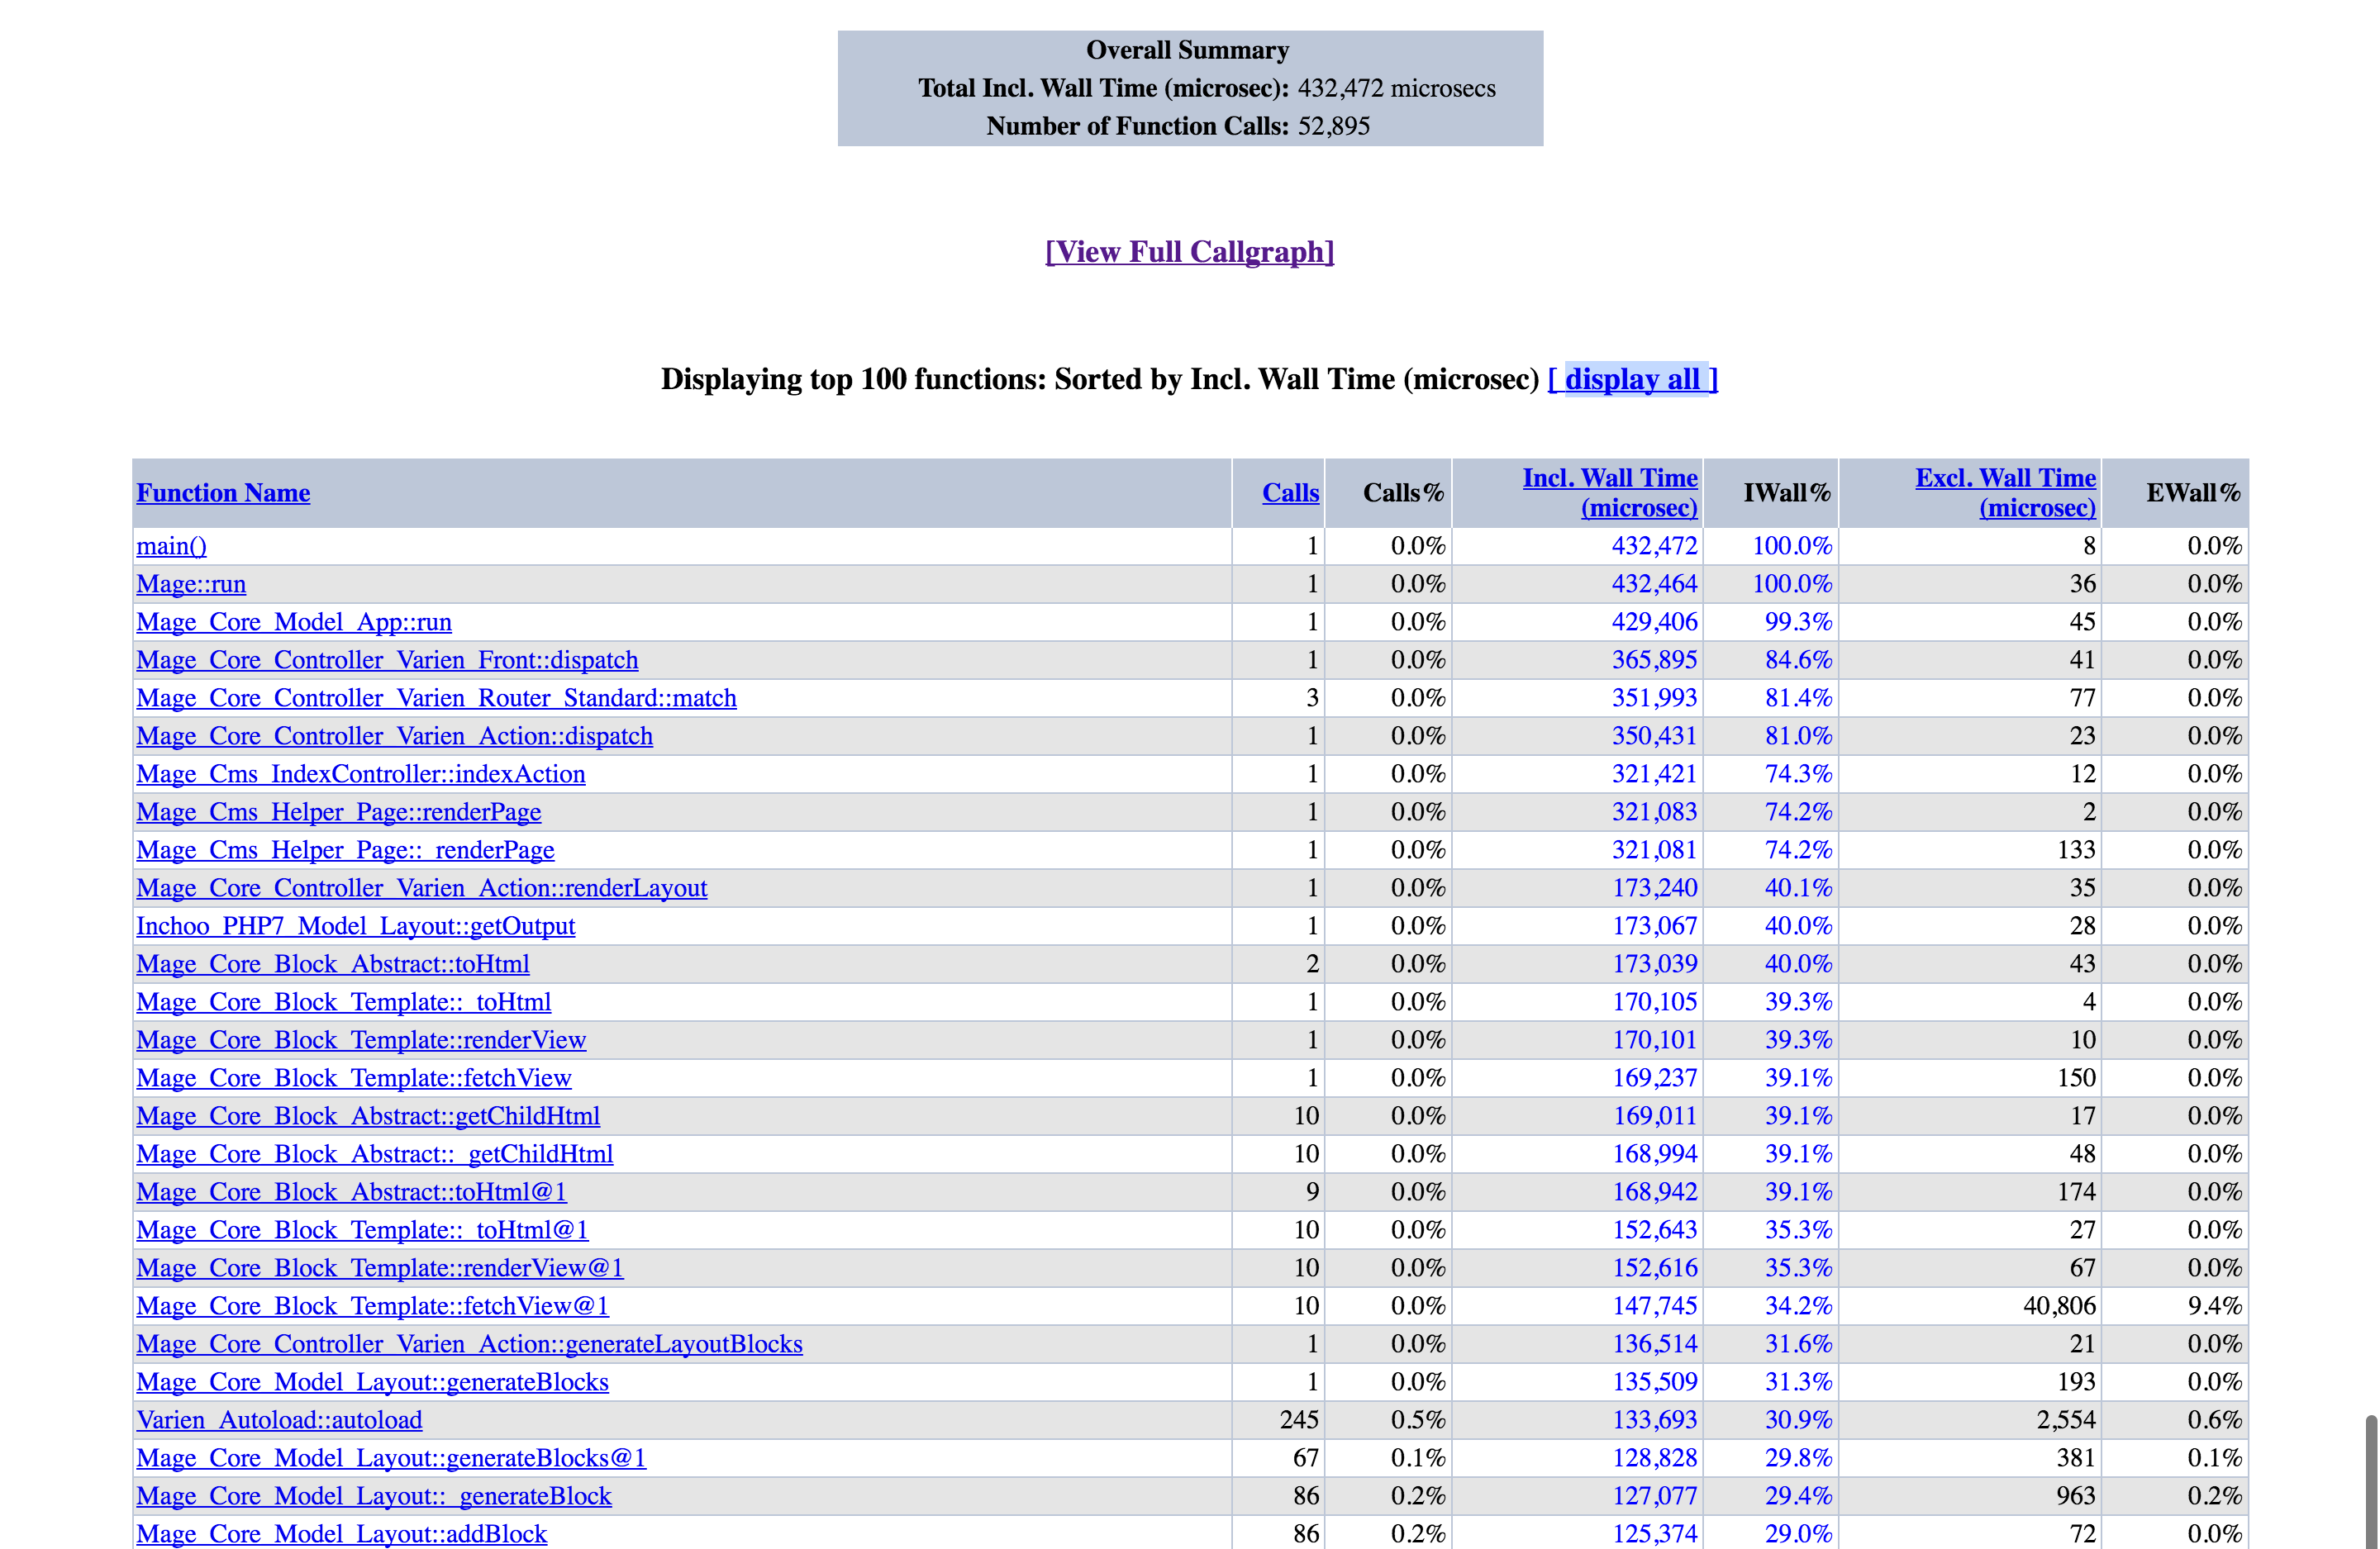
XHProf
As described on the github account of XHProf, it is a function-level hierarchical profiler for PHP and has a simple HTML based user interface. It is not that much maintained by the author but it is still working if you use the PHP 7 version thanks to longxinH user.
A GUI is also available to anaylze XHProf result on https://github.com/preinheimer/xhprof. Like with Webgrind, you can export the callgraph if dot on linux is intalled (apt-get install graphviz).
You will have to enable the profiler in the similar way as the one you do with the Varien_Profiler::start('key'); ...; Varien_Profiler::stop('key'); in Magento.
You can find a gist to patch Magento index.php to enable xhprof when you are in developer mode, on github.
Please be aware, that you need to install the xhprof project into the root path of Magento to make it works (or somewhere else but you must change the path of the library into the index.php).
To get access to the analyze, you will need to get the run_id and provide it to a similar link http://mydomain.dev/xhprof/xhprof_html/index.php?run=$run_id&source=xhprof_magento. If you use the piece of code of the gist, you will find the implementation to get it.
How it works?
$XHPROF_ROOT = '.';
require_once $XHPROF_ROOT . "/xhprof/xhprof_lib/utils/xhprof_lib.php";
require_once $XHPROF_ROOT . "/xhprof/xhprof_lib/utils/xhprof_runs.php";

xhprof_enable(XHPROF_FLAGS_NO_BUILTINS);

... // part of the code to analyze

$xhprof_data = xhprof_disable();

// save raw data for this profiler run using default
// implementation of iXHProfRuns.
$xhprof_runs = new XHProfRuns_Default();

// save the run under a namespace "xhprof_foo"
$run_id = $xhprof_runs->save_run($xhprof_data, "xhprof_magento");
More documentation about XHProf on PHP.net Website.
Blackfire.io
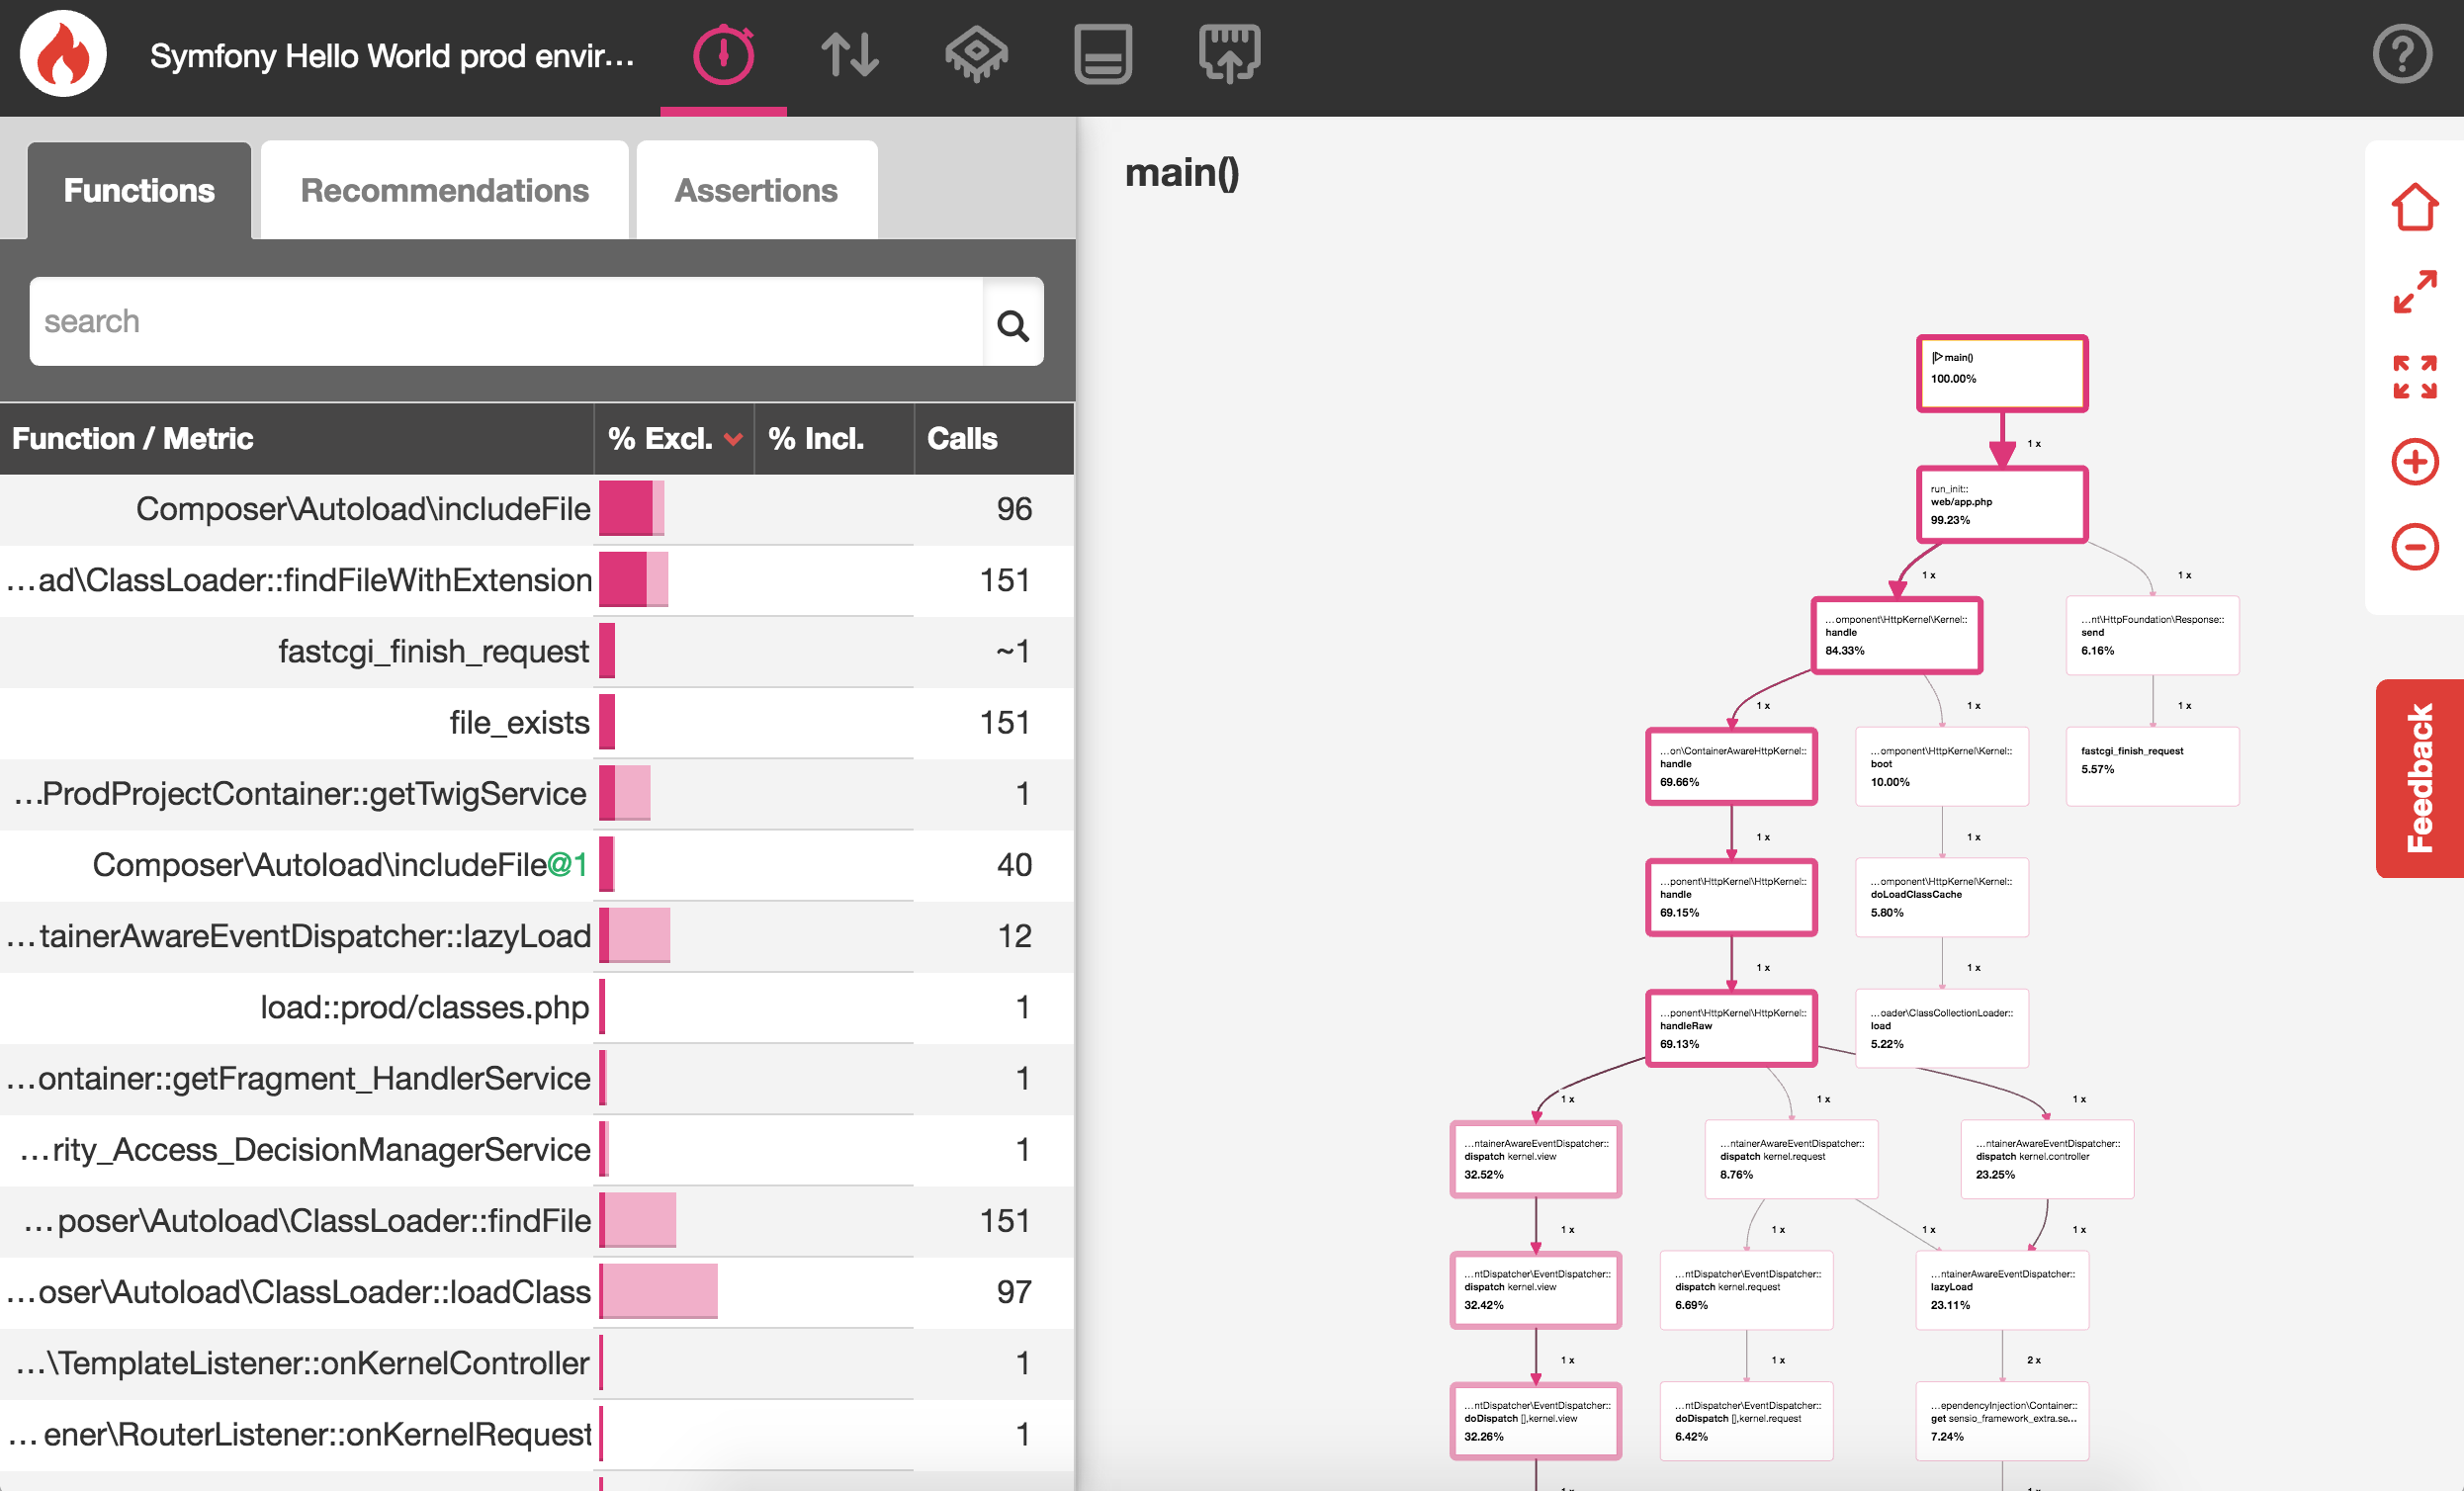
Blackfire.io is a profiling tool for PHP but also SQL requests. It is developed by the same company behind Symfony and it's french, Cocorico ! :-)
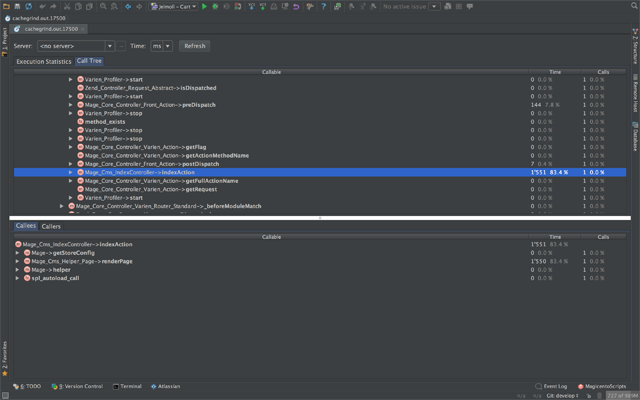
It analyzes your pages, detect where are the bottlenecks and provide you for some cases, some usefull tips. The callgraph is glued together with the call tree, when you click on a method of your application, the callgraph shows you where this method is located into the graph and highlight it. It facilitates to detect caller and callees and number of times the method is called.
Compared to NewRelic or Tideways, Blackfire.io profiles your web pages only on demand. It is for me a little bit annoying as I didn't find a way to profile a POST request from a form page. When you profile a page, you have to visit the page and with the Chrome extension, trigger the profiling. You can also do it per command line. So you could simulate a POST request per command line. There is easier tool for that!!! Or may be I'm an idiot and didn't find the correct way. On the other hand, the on-demand analyze makes sense to prevent server overhead on production server.
Except this case, I really like the tool. It's easy to use, you understand rapidily how it works, it's fast to install and you can quickly discover where are the bottlenck thanks to the color code in the callgraph and the times they need to be executed. Navigate between the methods of your application, check which is the caller and so on is really obvious. It was with this tool where I managed to gain more than 70% speed in a just an half day of work.
Blackfire.io like tideways allows you to compare two profiles, like that you can determine if your changes brought an improvement. You can't do it with NewRelic. Blackfire.io can also be used on production server.
The add-on for Magento 1.x (maybe for 2.x too, I don't know yet) gives you metrics of possible bottlenecks. For example, if you load a catalog product model in Magento more than once on a product page view, you will have a notification telling you that you should not. It's nice but I'm wondering if the 50€ / month additional cost, make sense for such a feature.
How it works?
You will have to install an agent and a PHP probe on your server. The probe is a PHP module necessary to analyze the PHP code while the agent will listen for data coming from the blackfire CLI or PHP probe to send them to blackfire.io (FAQ). You will have to configure the client token id and the server token id to make it works.
All instructions can be found on blackfire.io Website
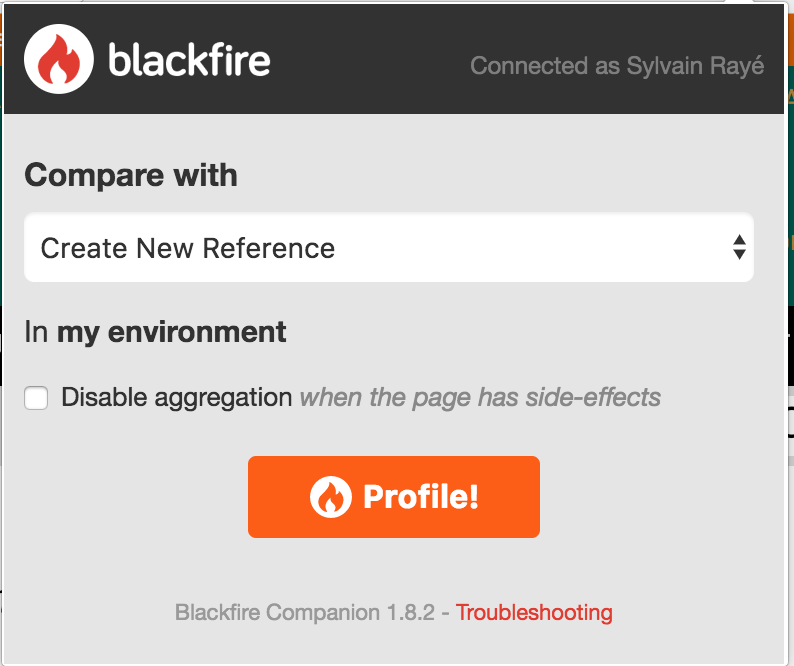
Once you installed it, you can, for example, profile a page thanks to the Google Chrome Extension, named as Companion by clicking on its icon, once the popup is open, you can create a reference for further use (comparison between the profiles) and click on Profile to launch the profiling. The page won't be reloaded, you don't need it, you will see however a progress bar and soon it is finished, you can watch the profile on blackfire.io.
Newrelic & Tideways
I put NewRelic & Tideways together as they are commercial monitoring tools and offer similar features. You may be mostly be influenced by the pricing model, as Tideways, a german solution is less expensive as NewRelic and offer from the basic plan what you need.
Both are mainly application monitoring tool and both provide a profiling tool for PHP. This is very interesting to use them on a production server as their memory footsprint is small.
Even if I prefer NewRelic to Tideways as NewRelic has more features regarding alerts and monitor also on frontend side, Tideways is better to get information about PHP profiling as more detailled and better organized, although I always struggle to find the callgraph as it is not for all traces available (I don't know why). Tideways gives you specific information like Blackfire.io when it sees bottlenecks when requests to MySQL are slow, for example.
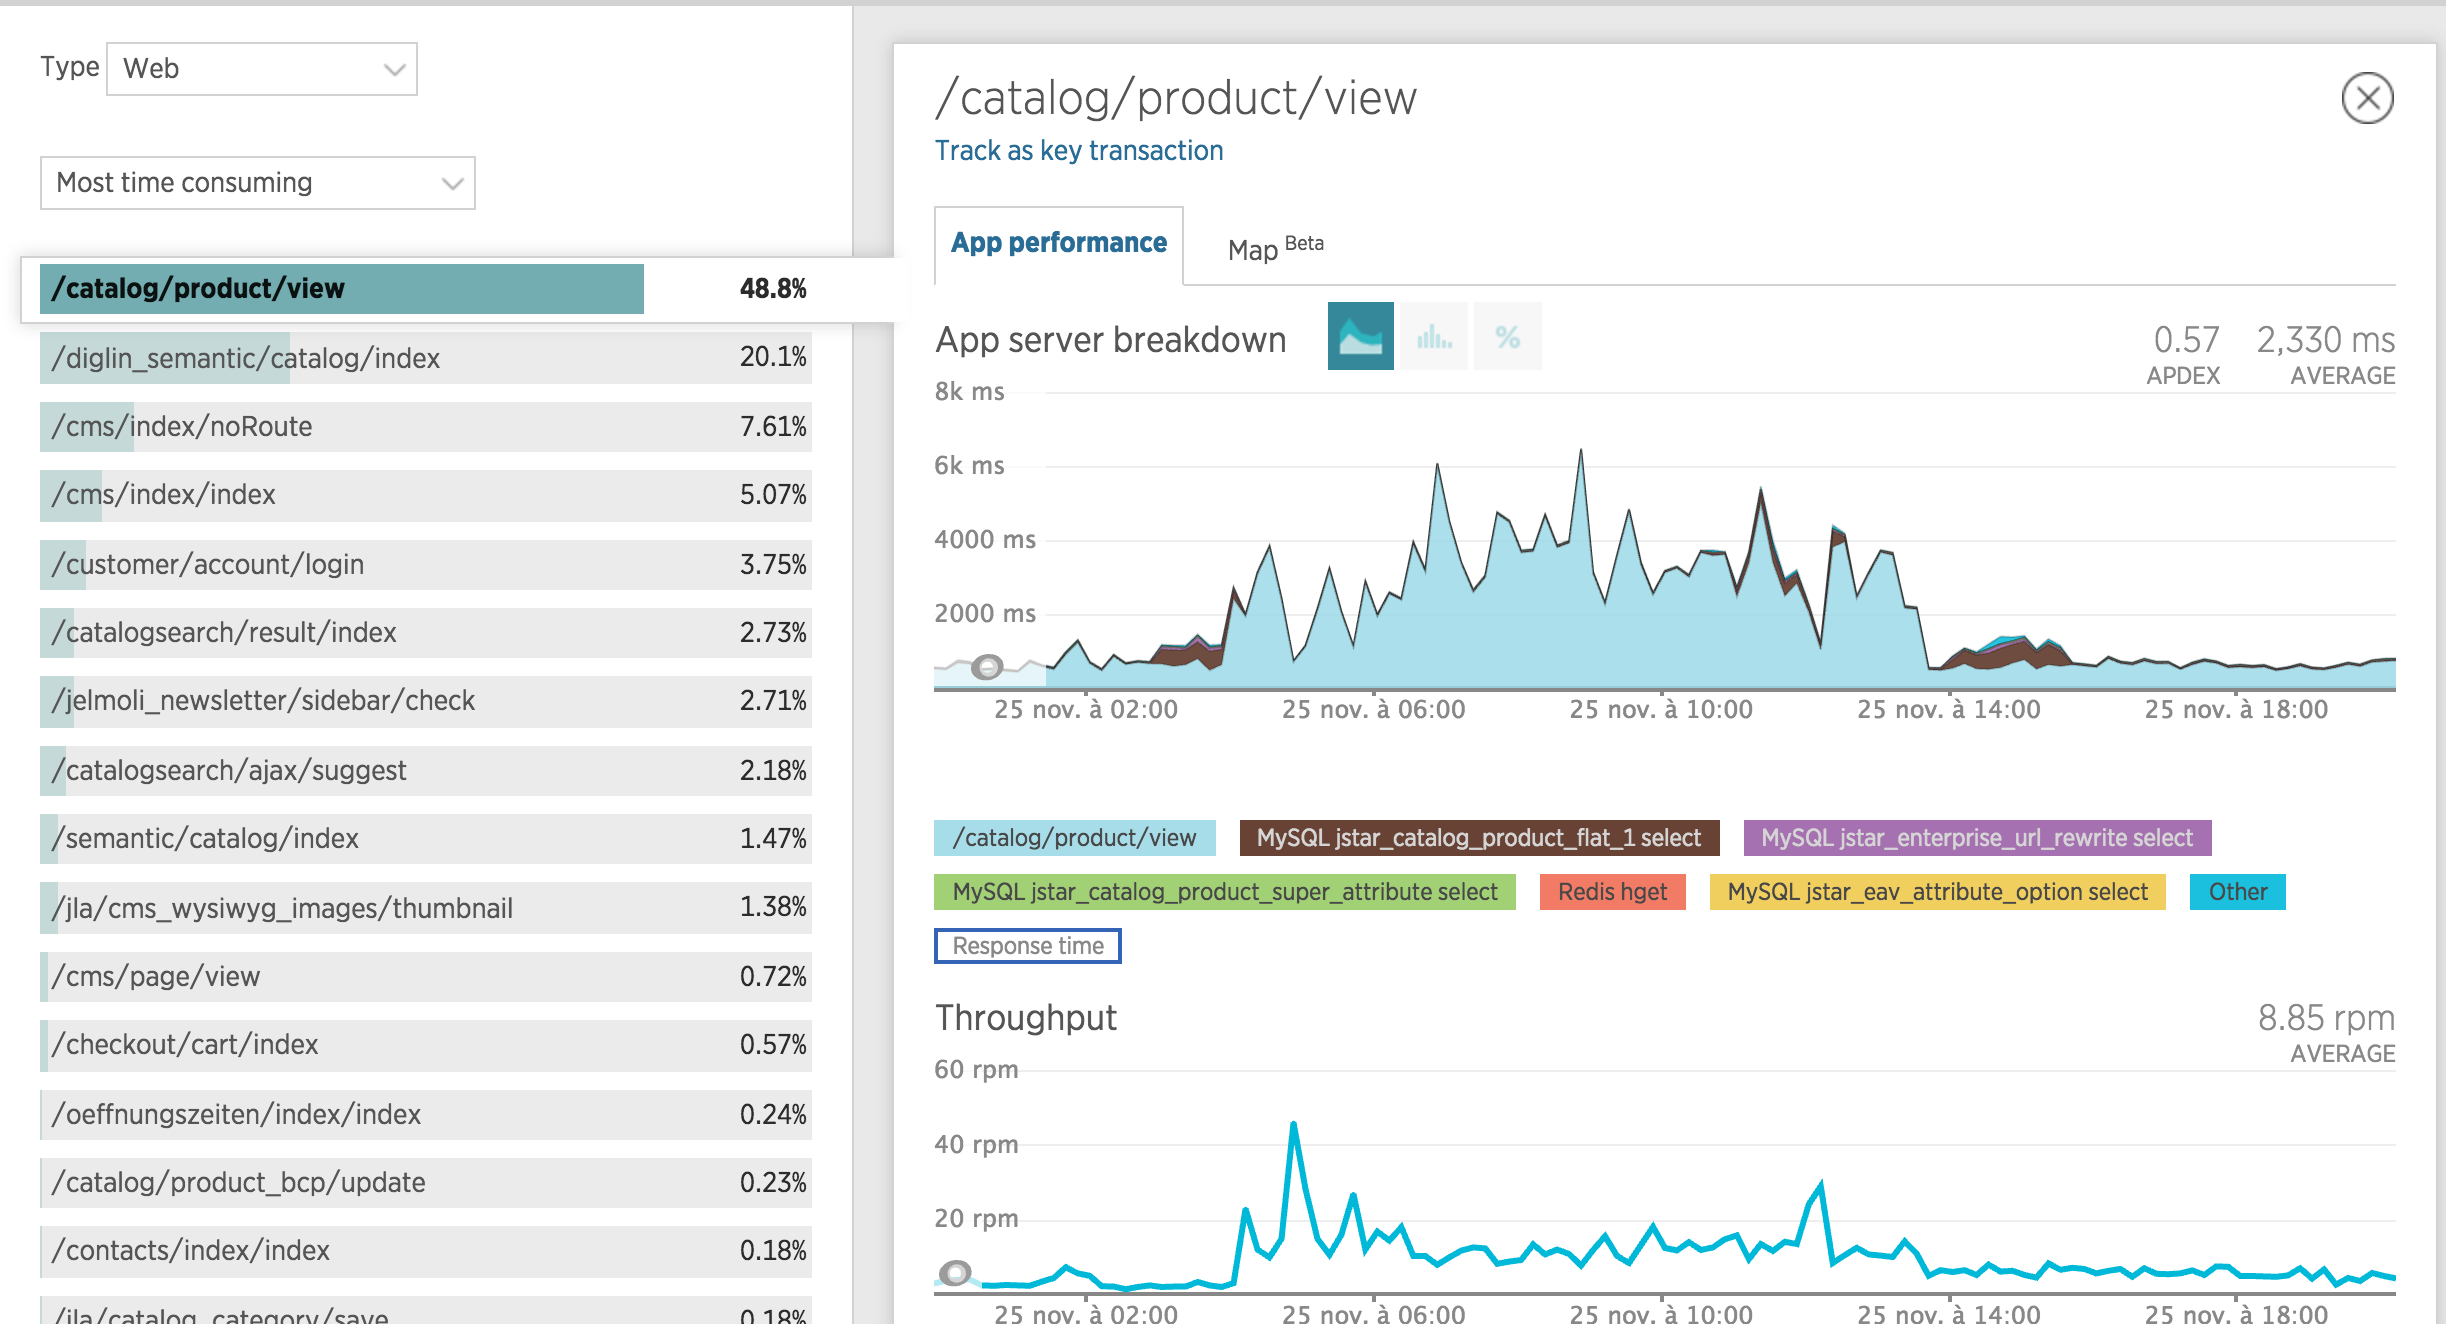
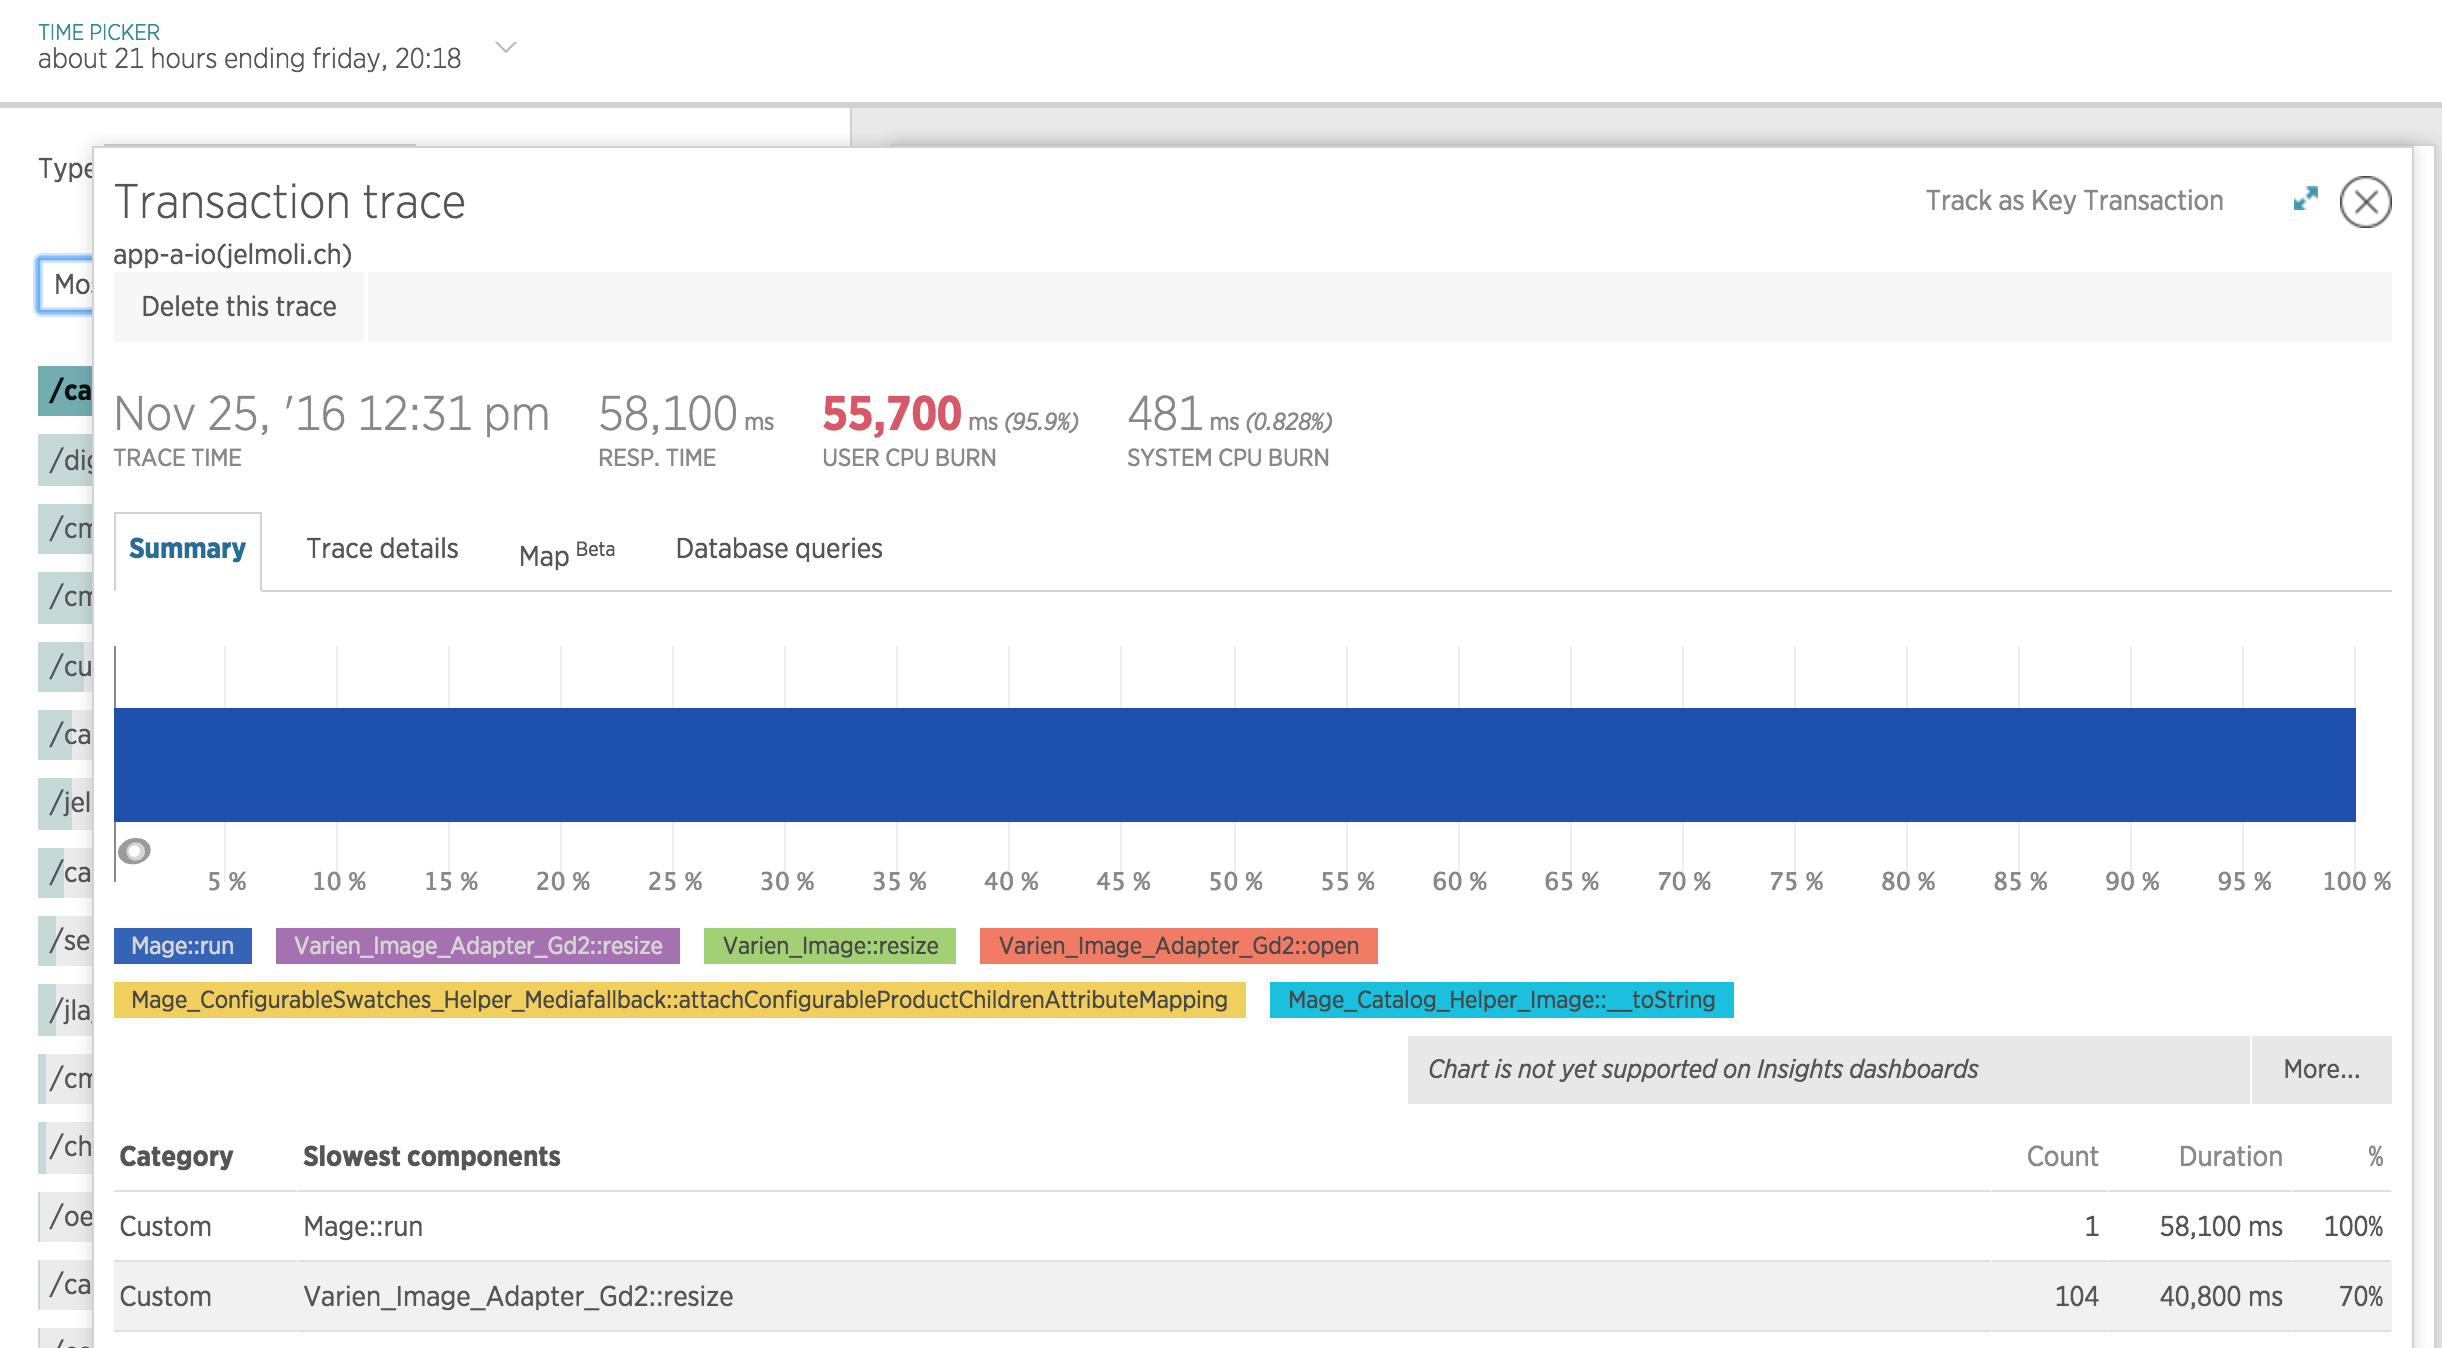
Newrelic tells you which script consums lots of resource, the problem is that you need to upgrade the plan to a paid plan to have more information about the url which calls the script. You can't know with Magento, when the url is catalog/product/view which product page is slow. Even after an upgrade, the transacton trace shows you which class or methods slow down the page but those information are really limited. You don't have a graph of the caller and callees.
NewRelic is really limited on this topic.
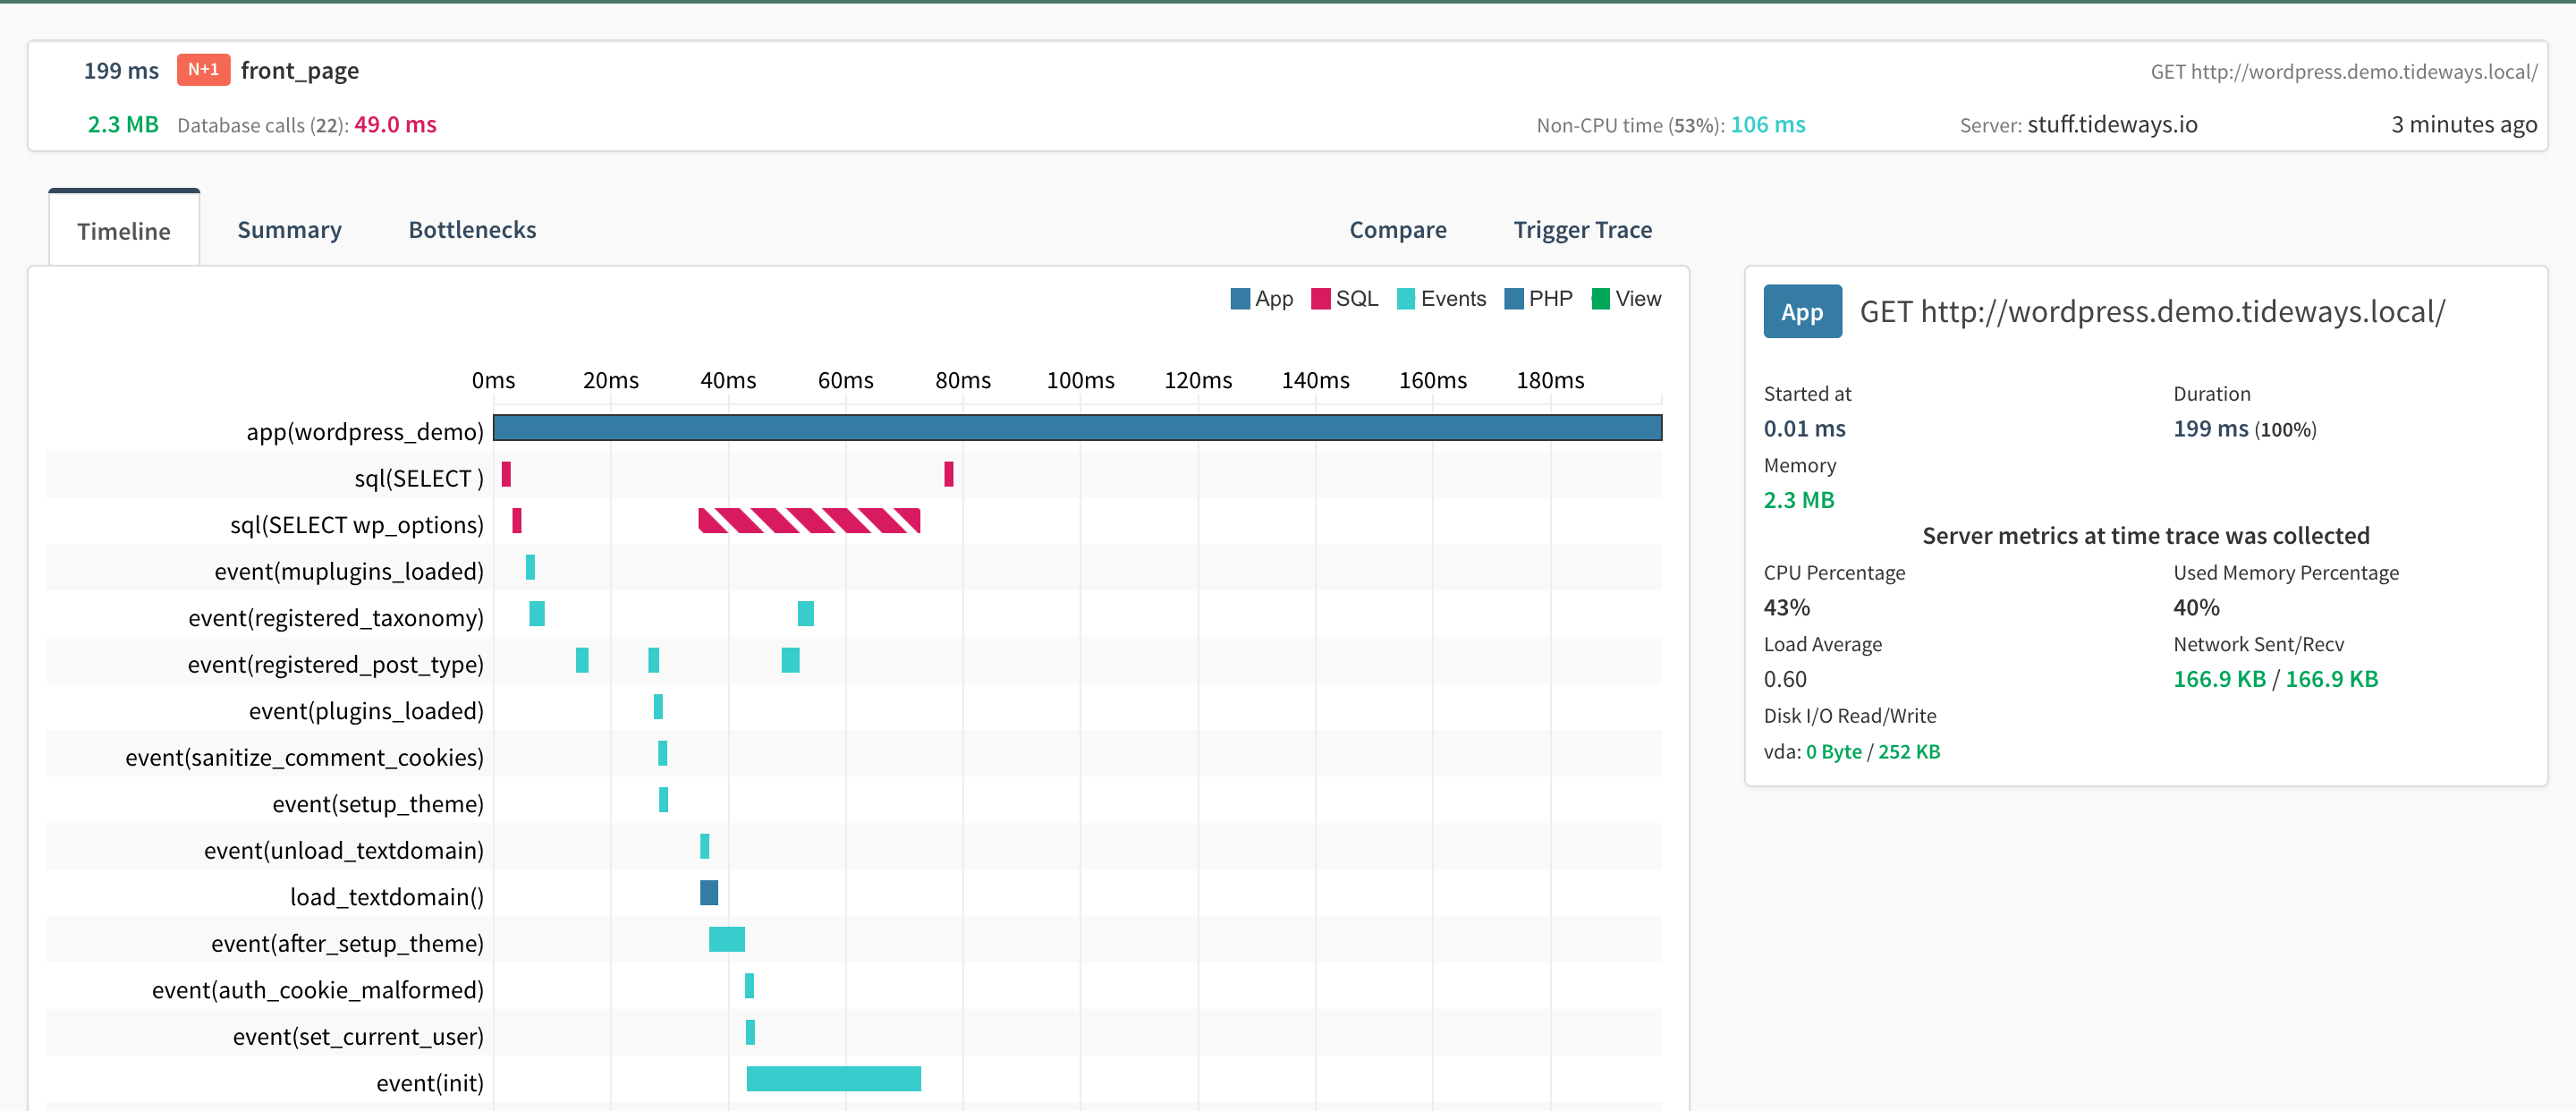
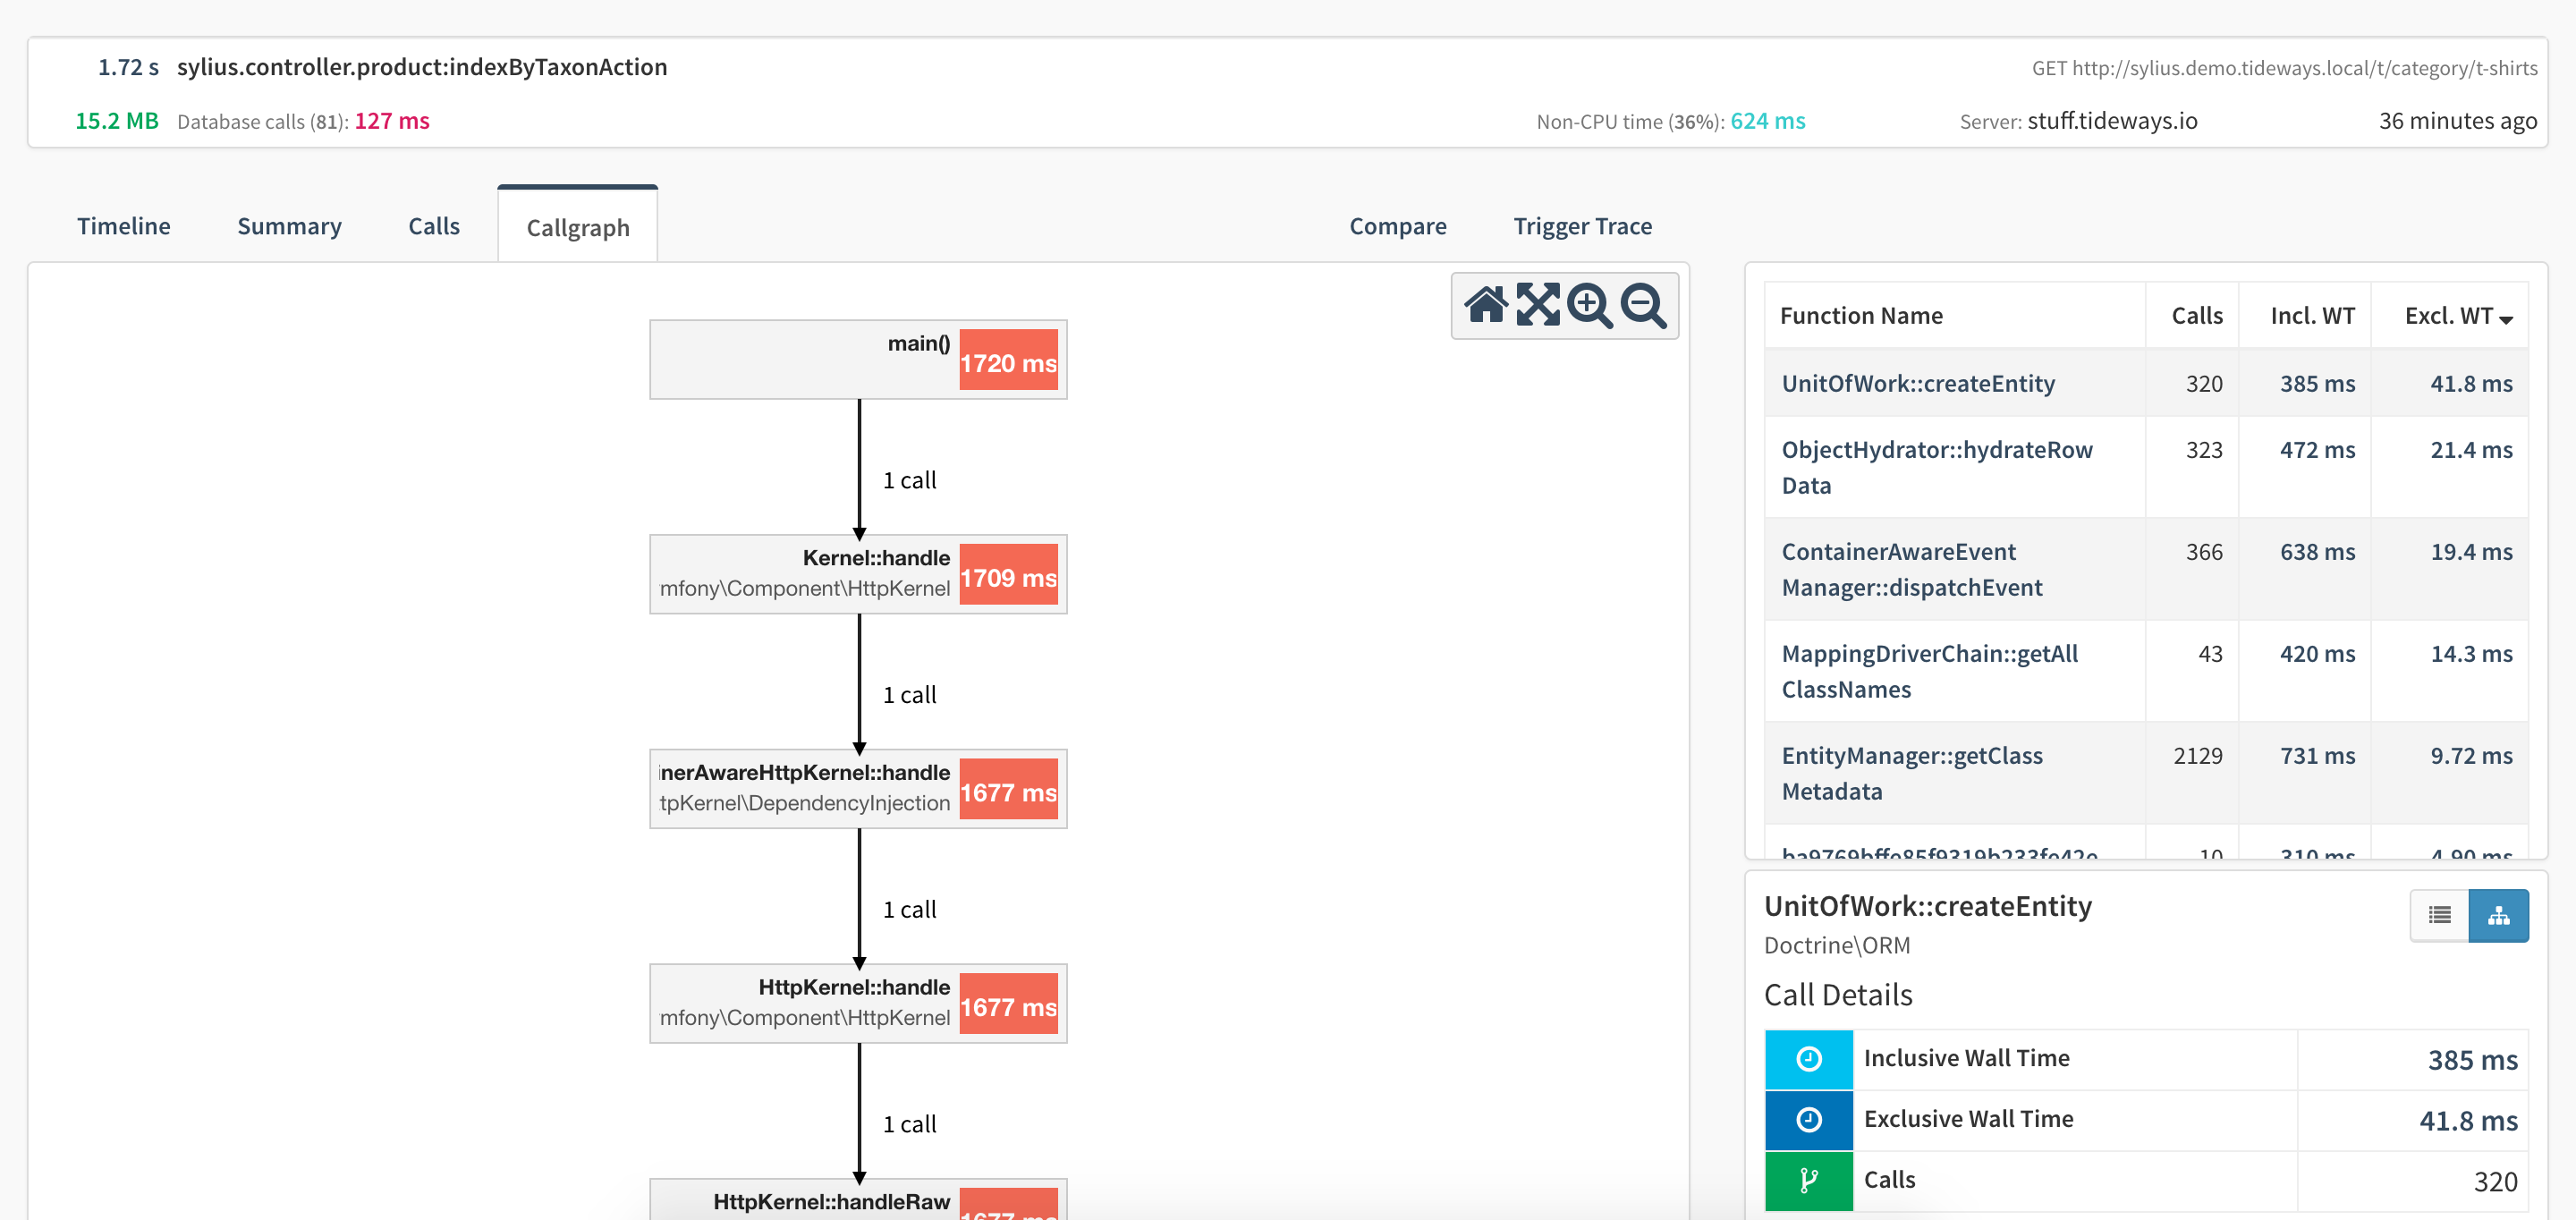
Tideways PHP Profile and Callgraph
NewRelic Profile
Conclusion
After writing this blog article, I have to admit that all those solutions are good and even complementary. You can use Xdebug as debugger, replace its profiling tool with Blackfire.io for development and test purpose and monitor your application with NewRelic and get live profile information on tideways.
If you need to improve the performance, blackfire.io will help you a lot. If you wish to limit the cost, go for xdebug profiler and use the free plan of NewRelic to have an idea of the performance. In case of high traffic or need analyze on production server, go for a paid plan for NewRelic or Tideways.
We didn't discuss in detail about how to resolve the bottlenecks. You just need to find which methods consums too much time to be executed thanks to the tool mentionned before and find a solution by using caching or prevent loading model via getModel methods or use getCollection()->getFirstItem() in Magento 1.x, replace it by calling the database directly and save the result in cache or you may use more efficient PHP core methods. The idea behind to not load data from model in Magento, is to shortcut dispatch events which may slow down a lot the process.
Enjoy to try yourself the tools which fulfill your expectations. I wish you a nice christmas time and see you at the next event.